AI in Marketing 2: Modern Measurement and Multi Touch Attribution Models
Understanding measurement is key to understanding and evaluating modern AI technologies. Most AI techniques rely on an evaluation function in order to learn the ones that don't, also use measurement to evaluate the overall performance of the system. If your evaluation/measurement techniques are unreliable the model performance will be as well.
Measurement is a core problem that has plagued marketers and its common knowledge that the techniques are somewhat unreliable. In the case of marketing, in order to use AI effectively you need to first understand the limitations of measurement techniques. This will allow you to understand the limitations of AI techniques that are trained based on this data.
What metrics are commonly relied on
1. Revenue
The goal of marketing is to drive sales so the purest metric is revenue. A common variation of this is annual recurring revenue which is often used for subscription products.
2. Cost per Acquisition/Return on Ad Spend
CPA and ROAS are the gold standard for advertisers. These metrics are used to gauge how efficiently marketing tactics are generating new revenue. Most advertisers have a customer acquisition cost baked into their business model so these metrics allow companies to gauge if they are acquiring customers in a profitable way.
This is a great metric but it isn't always available depending on the channel or phase in the marketing funnel your activity is running at. We discuss these details further on.
3. Engagement Metrics
Engagement metrics such as Click Thru Rate and View Thru Rate are commonly used as key metrics further up the funnel when you don't expect to drive an immediate conversion but want to make your audience aware of the product and generate future demand. These metrics are also used in retention strategies when advertising to existing customers to encourage usage.
The key thing to remember about engagement metrics is they are not themselves the goal but a proxy for the goal. The goal of all marketing is to drive sales efficiently.
The goal of all marketing is to drive sales efficiently
Ideally we would use CPA or ROAS for every campaign but for an awareness campaign the attribution would be incredibly difficult. If we show a Super Bowl ad to a potential customer and a year later they buy the product how could be possibly determine how important that single ad was in the purchase decision a year later?
When we measure engagement metrics we are making the assumption that higher engagement directly correlates to more efficient sales. For most marketers this is obvious but its important to remember because when engagement metrics are used to optimize AI systems the contract with the system is that it will attempt to optimize that metric. There is no guarantee that this will positively impact sales.
4. Scale Metrics
Scale metrics such as total impressions or reach are often used at the top of the funnel when the goal is to talk to as many people as possible. The two important things here are cost of reaching people and the quality of the audience reached. In other words, how can we reach the most people while also making sure they are true potential customers. This type of equilibrium optimization is something AI systems to very well.
How we attribute conversions
At the root of all marketing is the conversion. The purchase a customer makes. The goal of attribution is to determine what degree each marketing activity played in driving a customer to make a purchase. There are many ways to attribute conversions, in this article we will only focus on Last Touch and Multi Touch Attribution models. Last touch is one of the most common models used by the big social platforms so we will briefly cover it and Multi Touch Attribution models illustrate some of the most interesting ideas in attribution and where AI can play a role so we will spend a lot of time here.
The Basic Idea
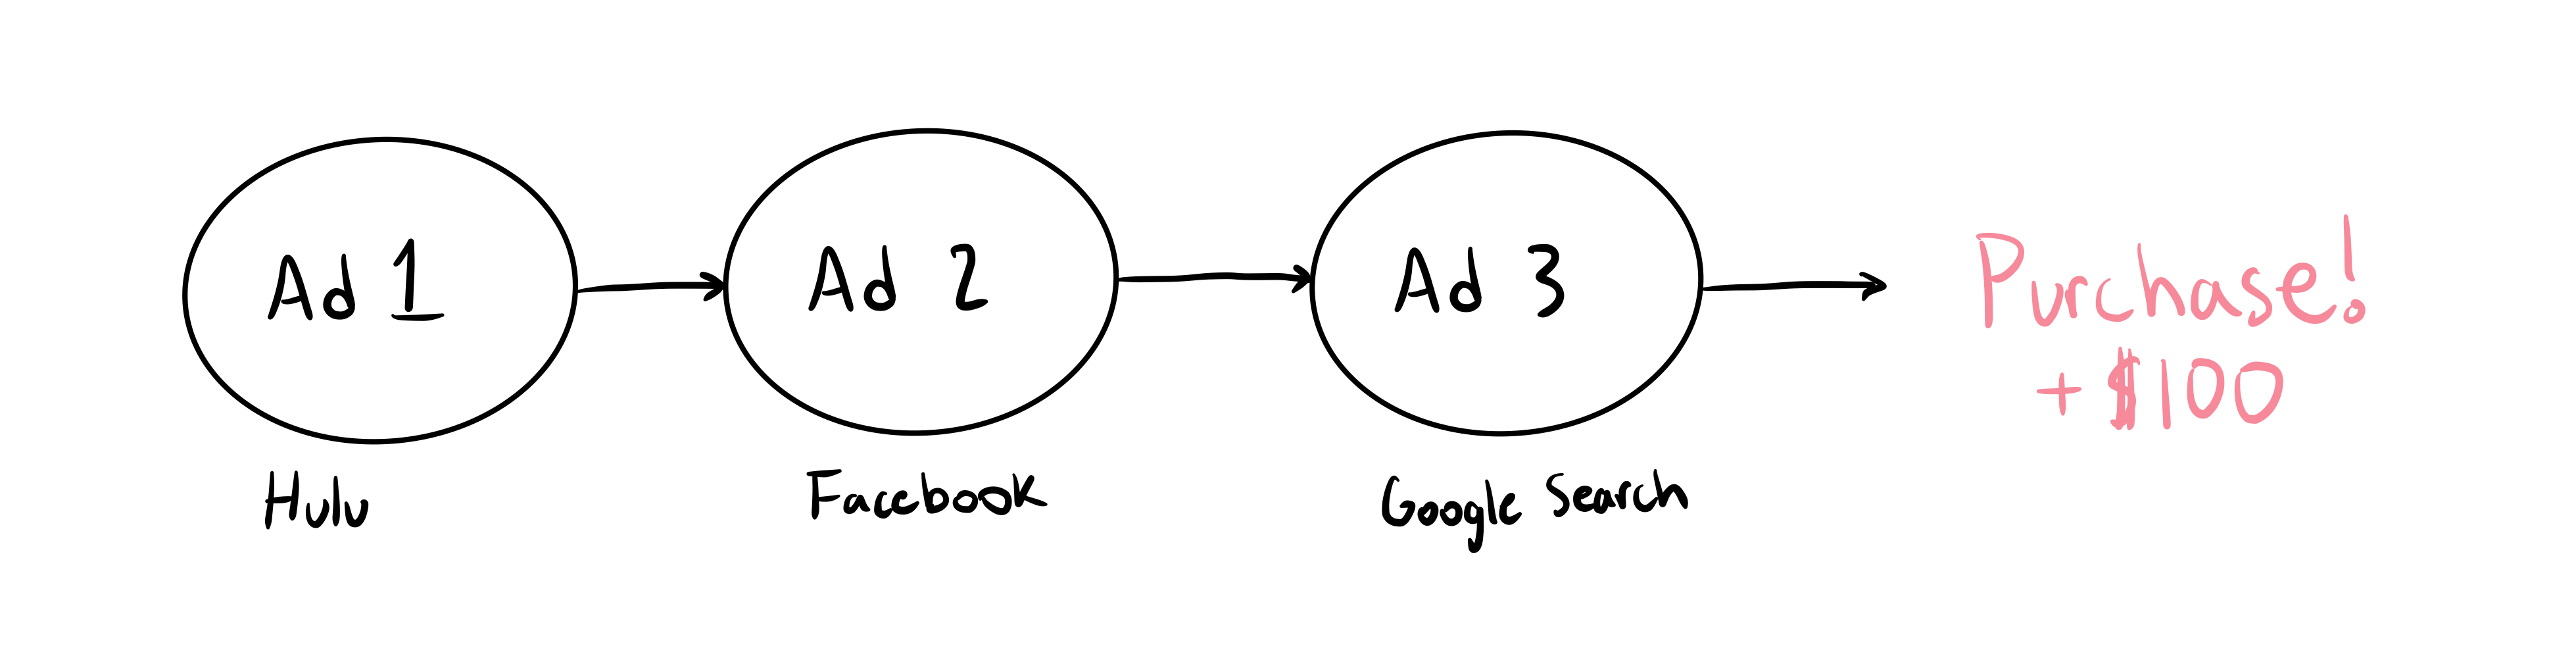
Ok, our customer saw an ad on Hulu, then some time after, they saw one on Facebook. Finally they saw a Google Search ad and made a $100 purchase. Who gets the credit?
Last Touch
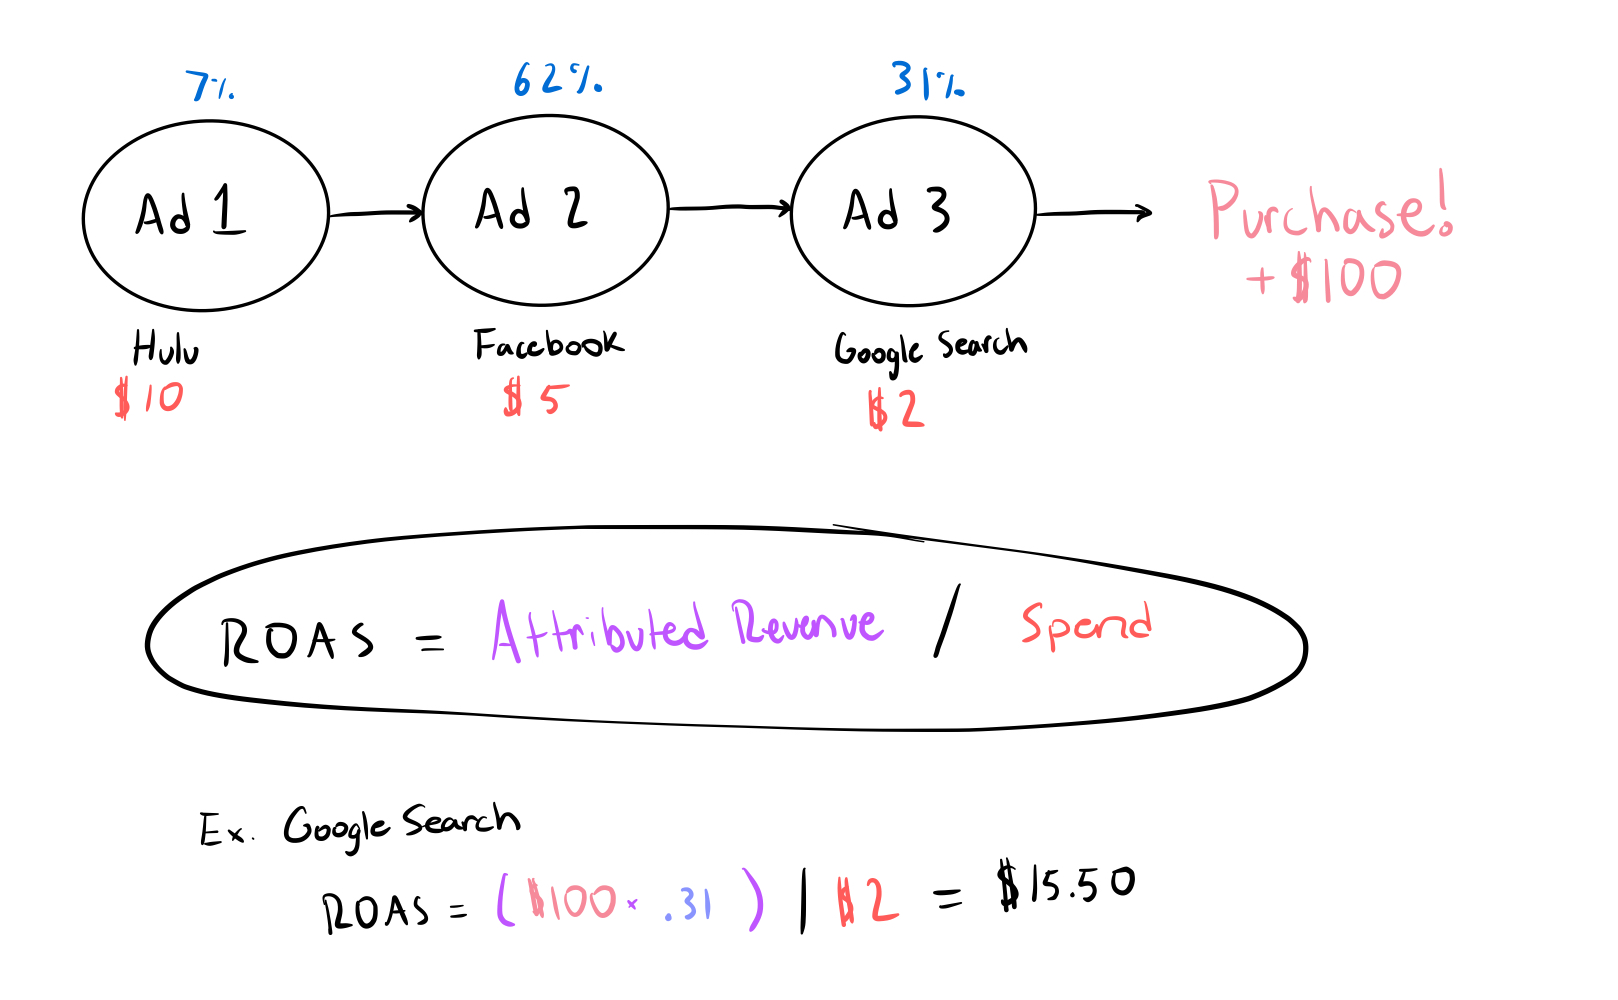
Each touchpoint gets a percentage of the credit. With Last Touch, Google Search gets 100% of the credit and Hulu and Facebook get 0%. We could use this percentage to calculate the ROAS.
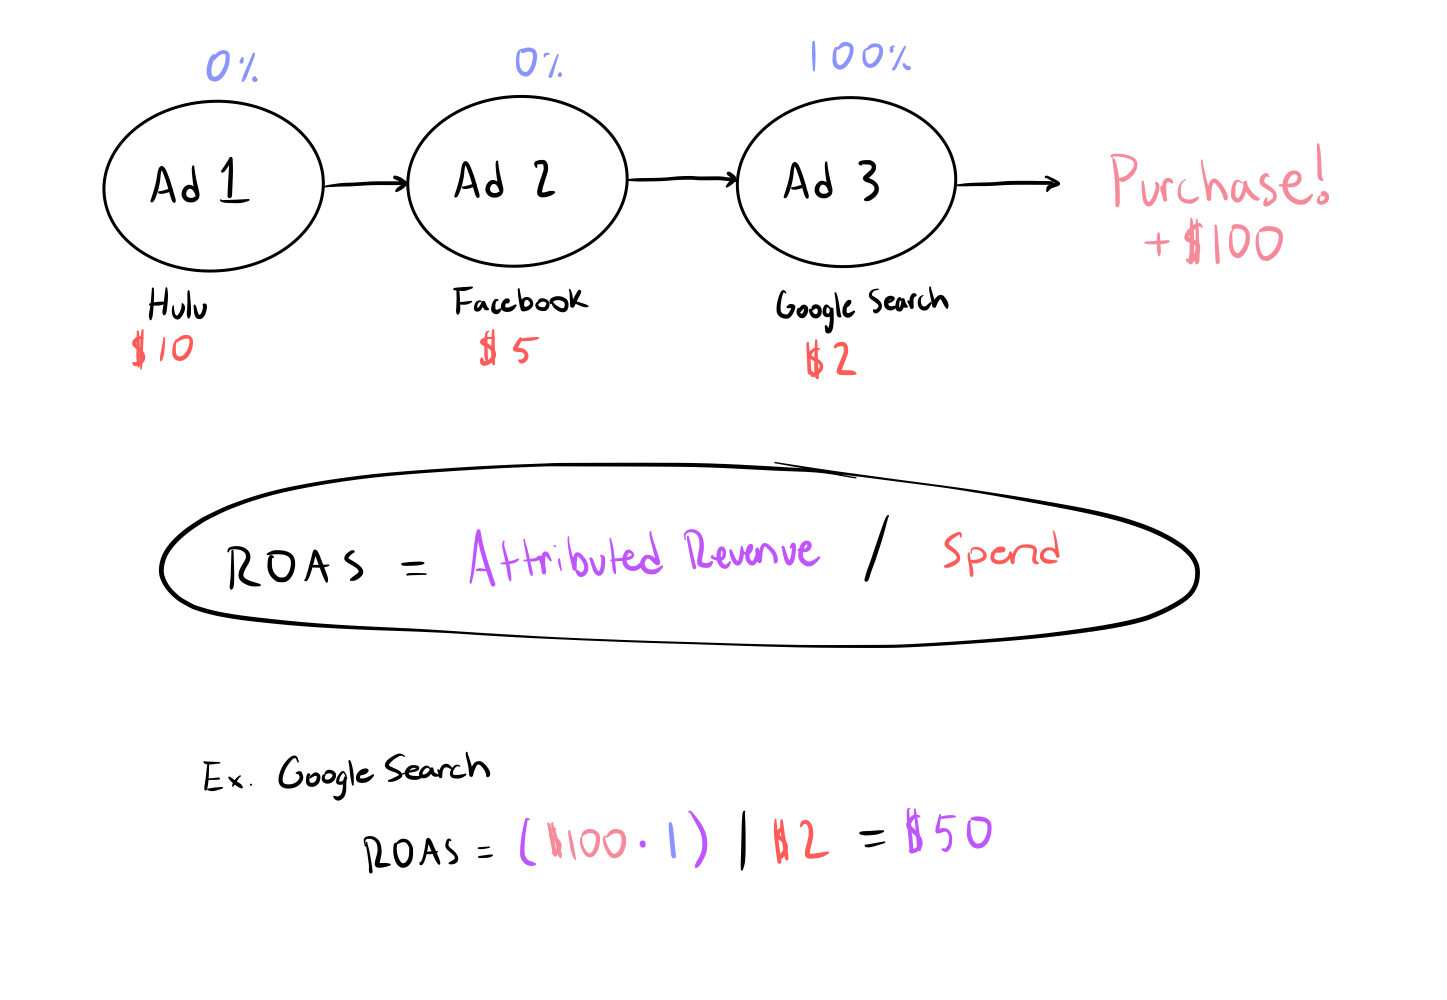
When we calculate the Return on Ad Spend, the Attributed Revenue takes into account the percentage of value we assign to the platform. In the Google Search example since the value is 100% we use 1 and the ROAS is $50. For this example since Facebook gets no credit the Attributed Revenue would be $100 x 0 which would make ROAS be $0.
Last touch is by far the most common method because in most cases advertisers use attribution models built by the publishers who only have access to the data from ads you run on their platform. In Last Touch attribution you give credit to the last touchpoint a customer has before making a purchase. For platforms this means if you are running multiple campaigns or ads the one seen/clicked most recently will be considered the ad that caused the customer to convert (as long as it falls within a specific conversion window).
Building a Multi Touch Attribution Model
In the Last Touch example we give all of the credit to Google Search which essentially says all of our other advertising is useless. This is not an accurate view of what each channel contributes. How can we accurately asses the value of each platform or touchpoint to properly assign credit when a customer makes a conversion?
Multi touch attribution models assume that every ad you see on the way to making a purchase assumes some level of responsibility for driving that purchase. The complexity comes in techniques used to assign weights to each touchpoint. Or, how we determine the value each platform has in generating a conversion.
There are many techniques and theories on how to determine accurate weights for each touch point. In this article will build a simple multi touch attribution model using three features (techniques) of varying complexity. This should give a good idea of how these models are built.
For this example lets imagine we have the same three platforms Hulu, Facebook and Google.
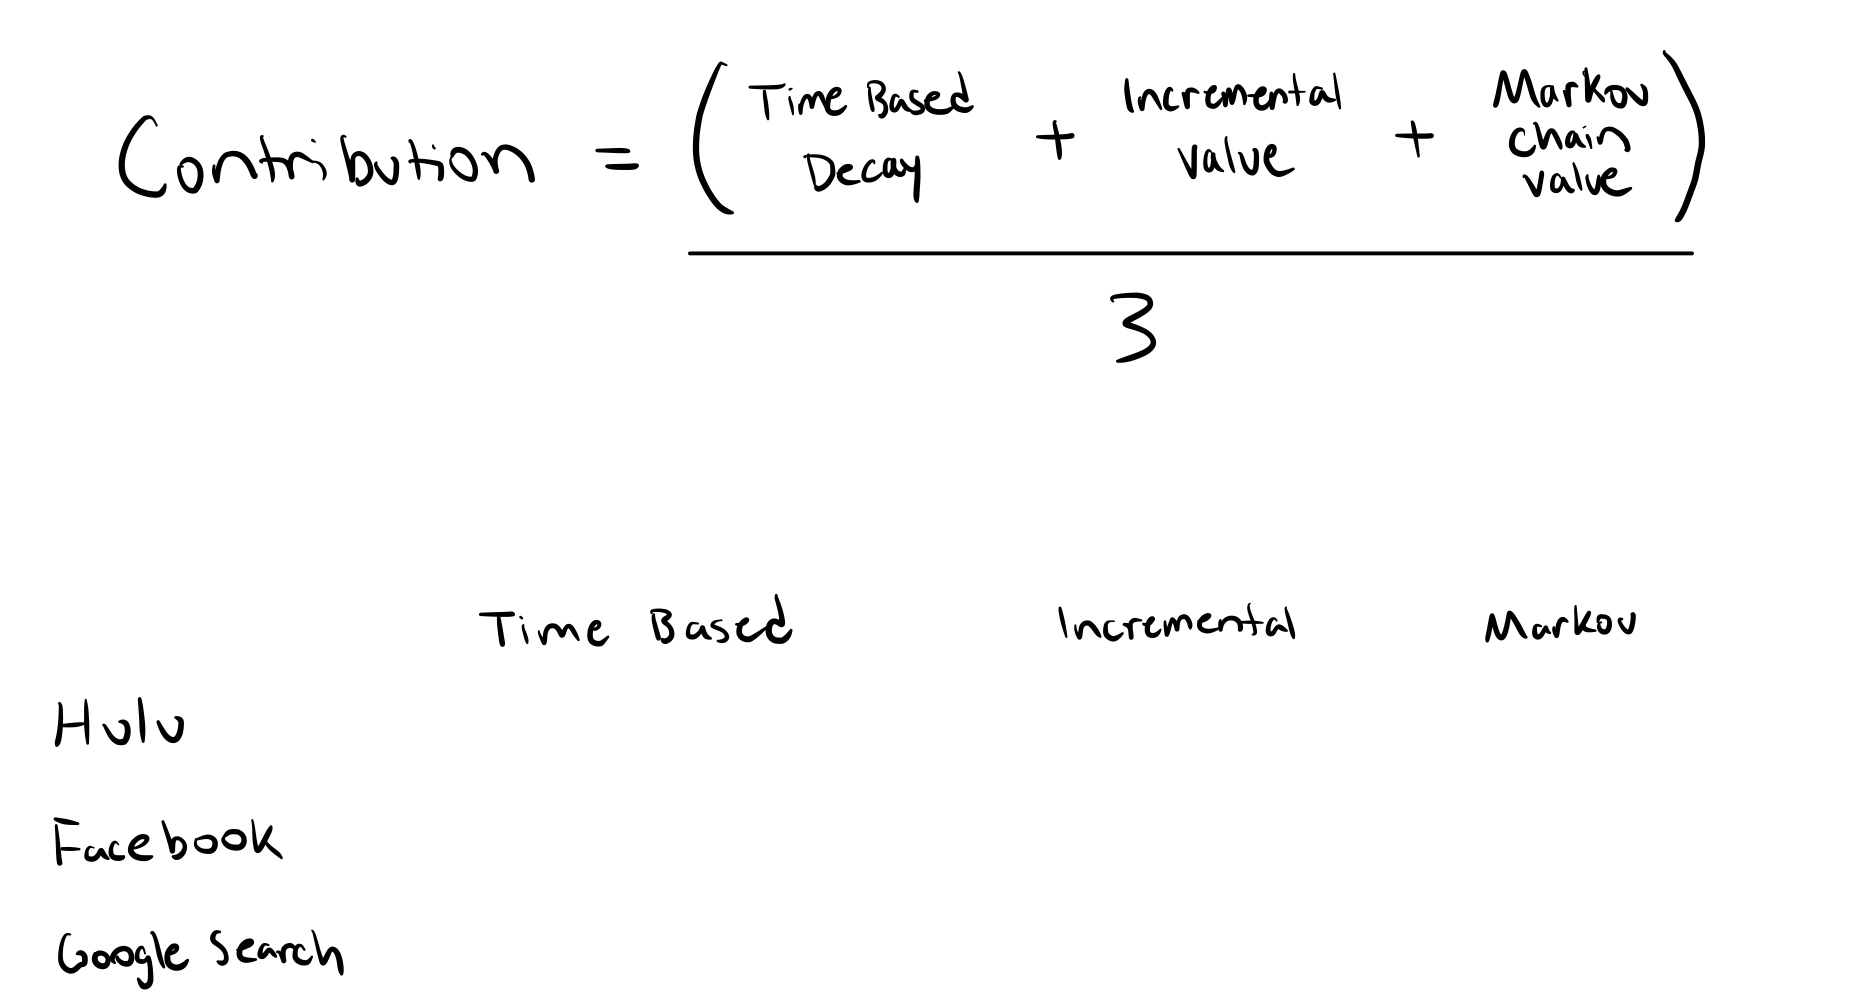
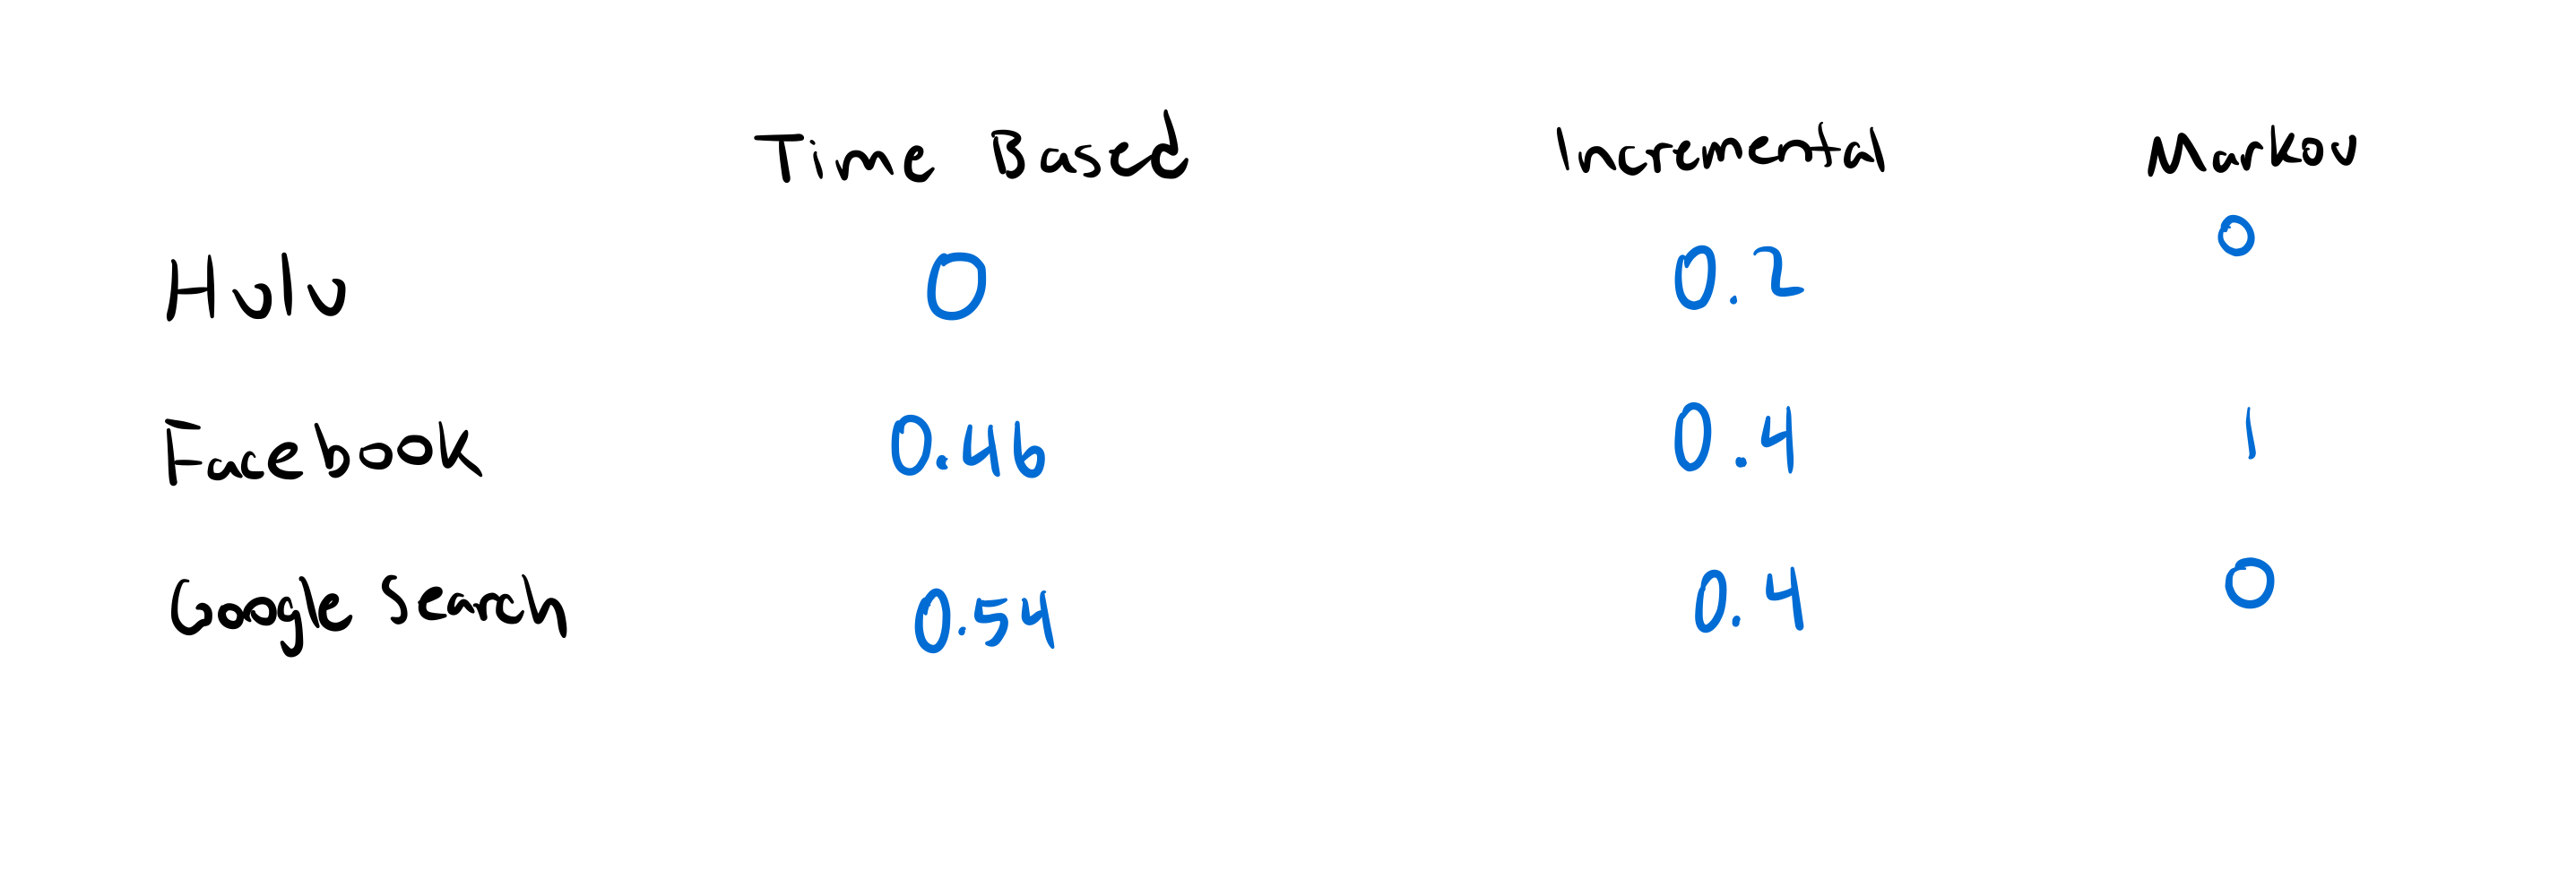
The contribution is the percent weight we assign to each platform. We will calculate three features Time Based Decay, Incremental Value and Markov Chain Value then average them to get the contribution.
Time Based
Ok lets say we have a theory that the value of an exposure goes down over time. The most important touch points would be the ones closest to the time of conversion. We can model that with some time based score. WE take the total number of touch points and assign a value to each touchpoint based on the order it was reached relative to the conversion.
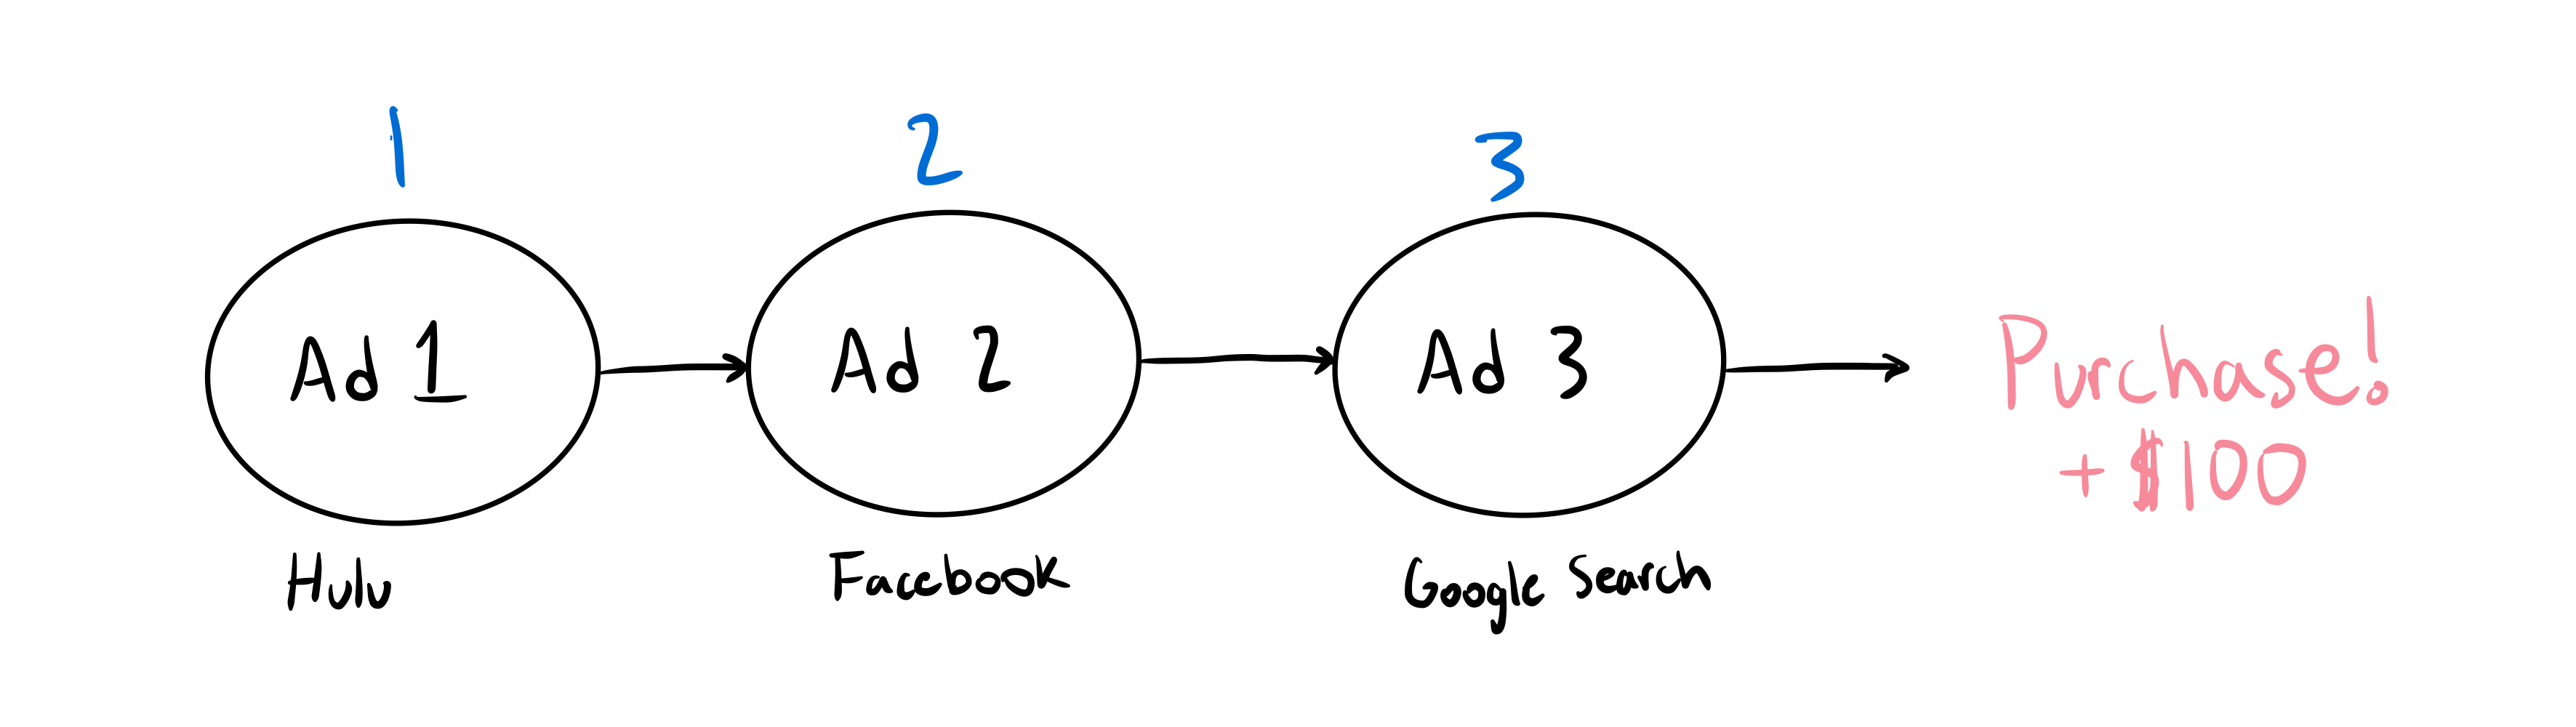
Google Search has the most value (3) and every other touch point loses value. We could use a more complex technique. For example the above takes into account ordering but not the number of days between each touch point. A touch point the day before a purchase was probably more impactful compared to a TV ad someone saw 2 months earlier right? Instead we can measure the number of days from a purchase each touchpoint was.
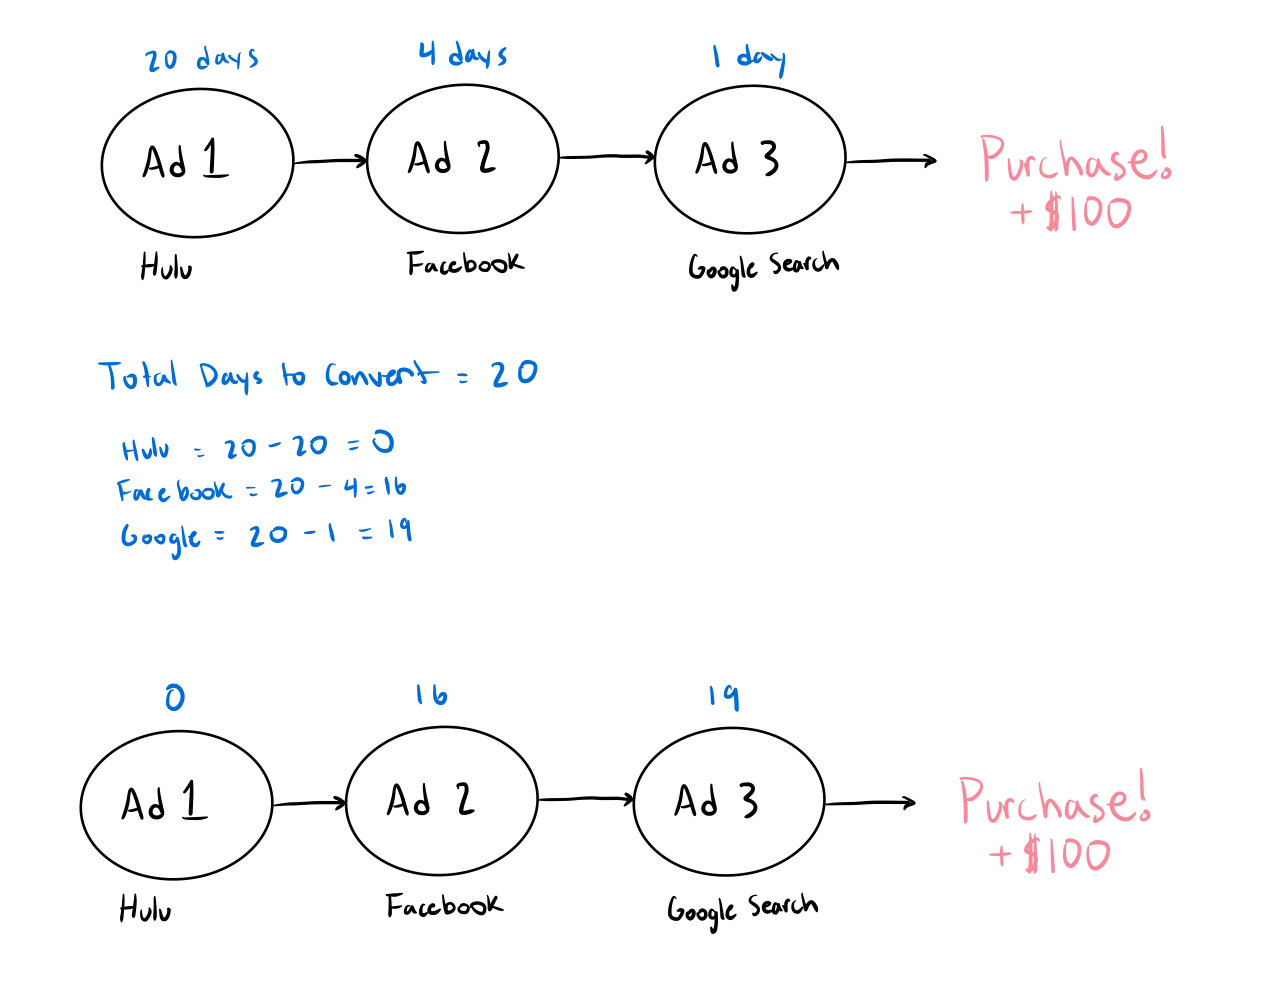
Finally we can normalize these values before adding them to our conversion percentage equation. We will take the sum (0 + 16 + 19) and divide each value by that sum.
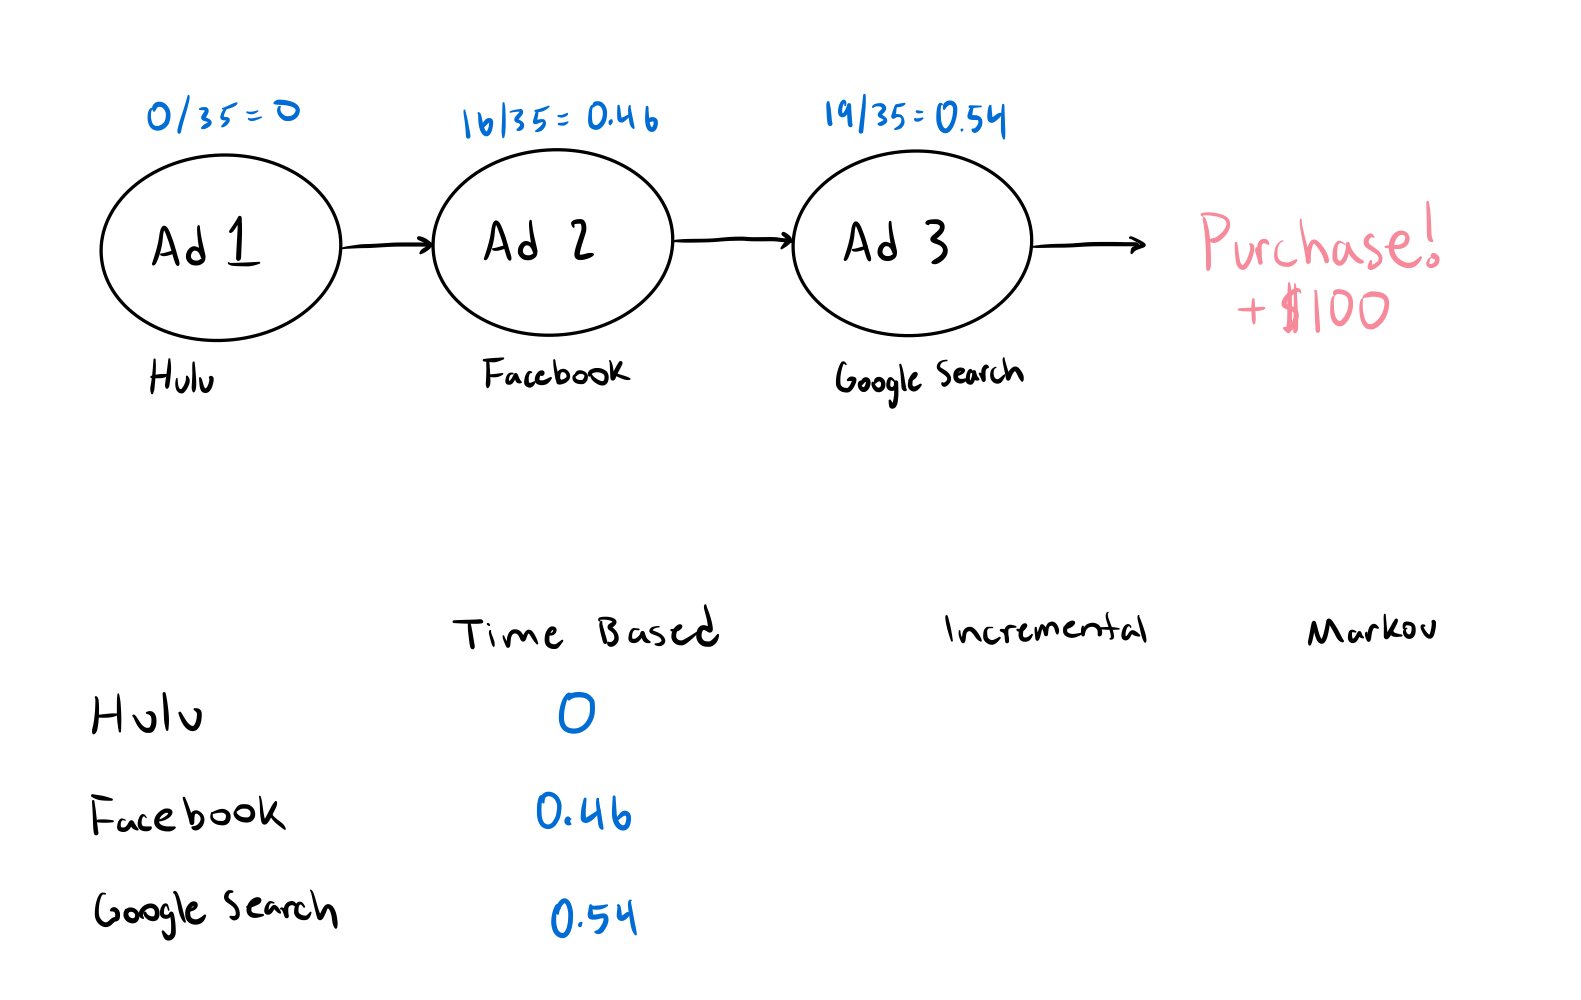
Now we have the Time Decay value for each touch point. Lets look at incrementalilty.
Incrementality Value
One common practice for marketing teams is incrementality tests. These tests seek to answer the question "Is my marketing spend driving sales". You hold out a percentage of your audience and see how likely they are to purchase your product without seeing an ad (baseline). Then you compare this to the likelihood of an exposed audience to purchase your product. The difference between the two numbers is the effect of advertising.
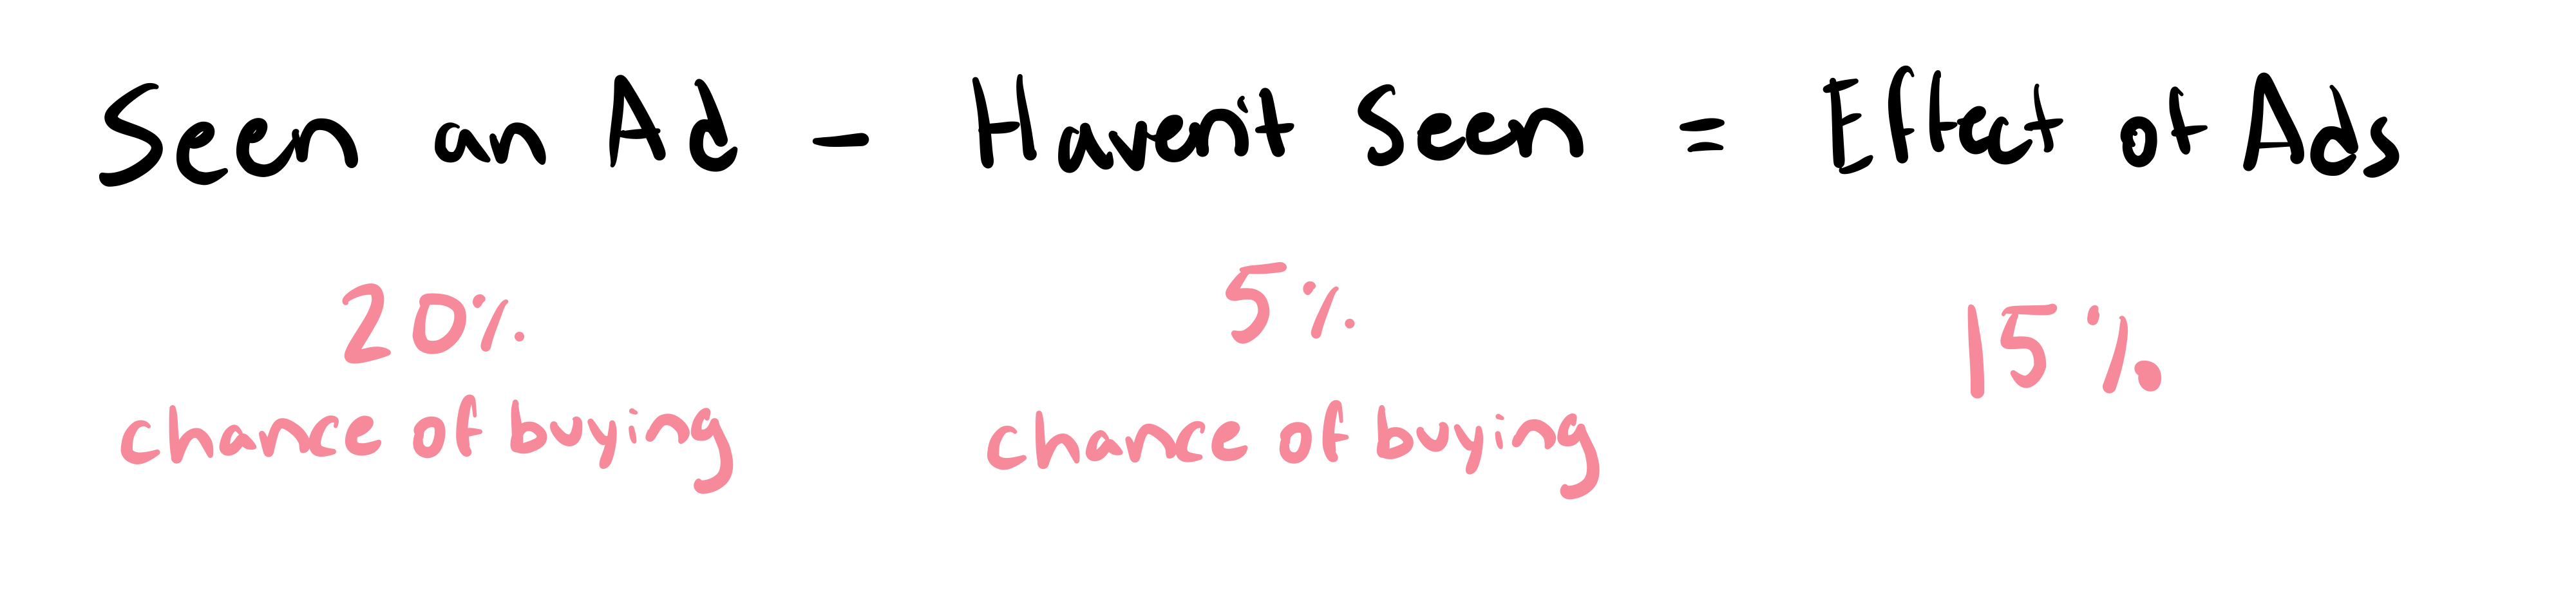
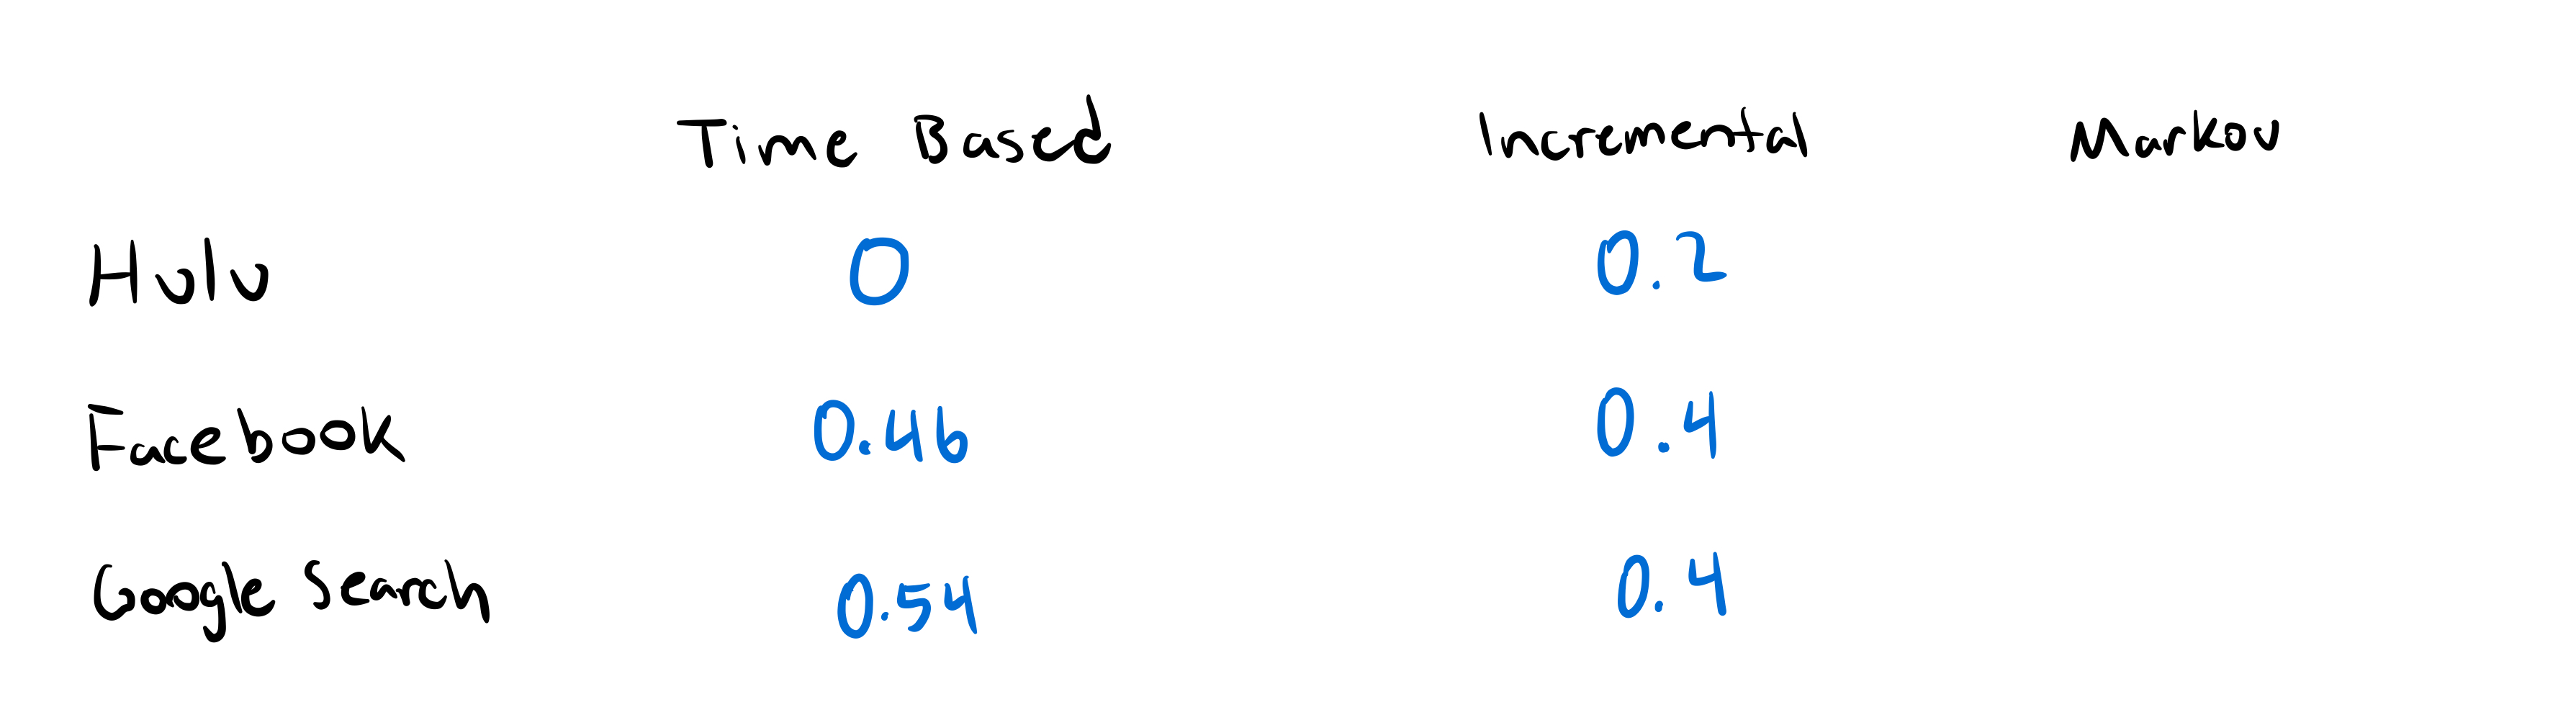
Imagine we conduct an incrementality test on each platform. We get varying percentages then normalize them and add them to our contribution formula.
Markov Chain Value
Finally Markov Chains. Markov chains are a common AI technique used to understand the probability of a future state based on the current state. In MTA modeling you can consider each touch point along a customer journey as a state and "Not Converted" and "Converted" to be the final states for every customer journey. Either a customer buys or they do not buy.
Markov chains are a basic AI technique but it is probably not necessary to understand them in detail for most marketers. Feel free to skim or skip this section if the detail is to much.
In the context of this model we will consider each touchpoint and converted/not converted to be the states. Then we will calculate the probability of going to any other state from the each state.
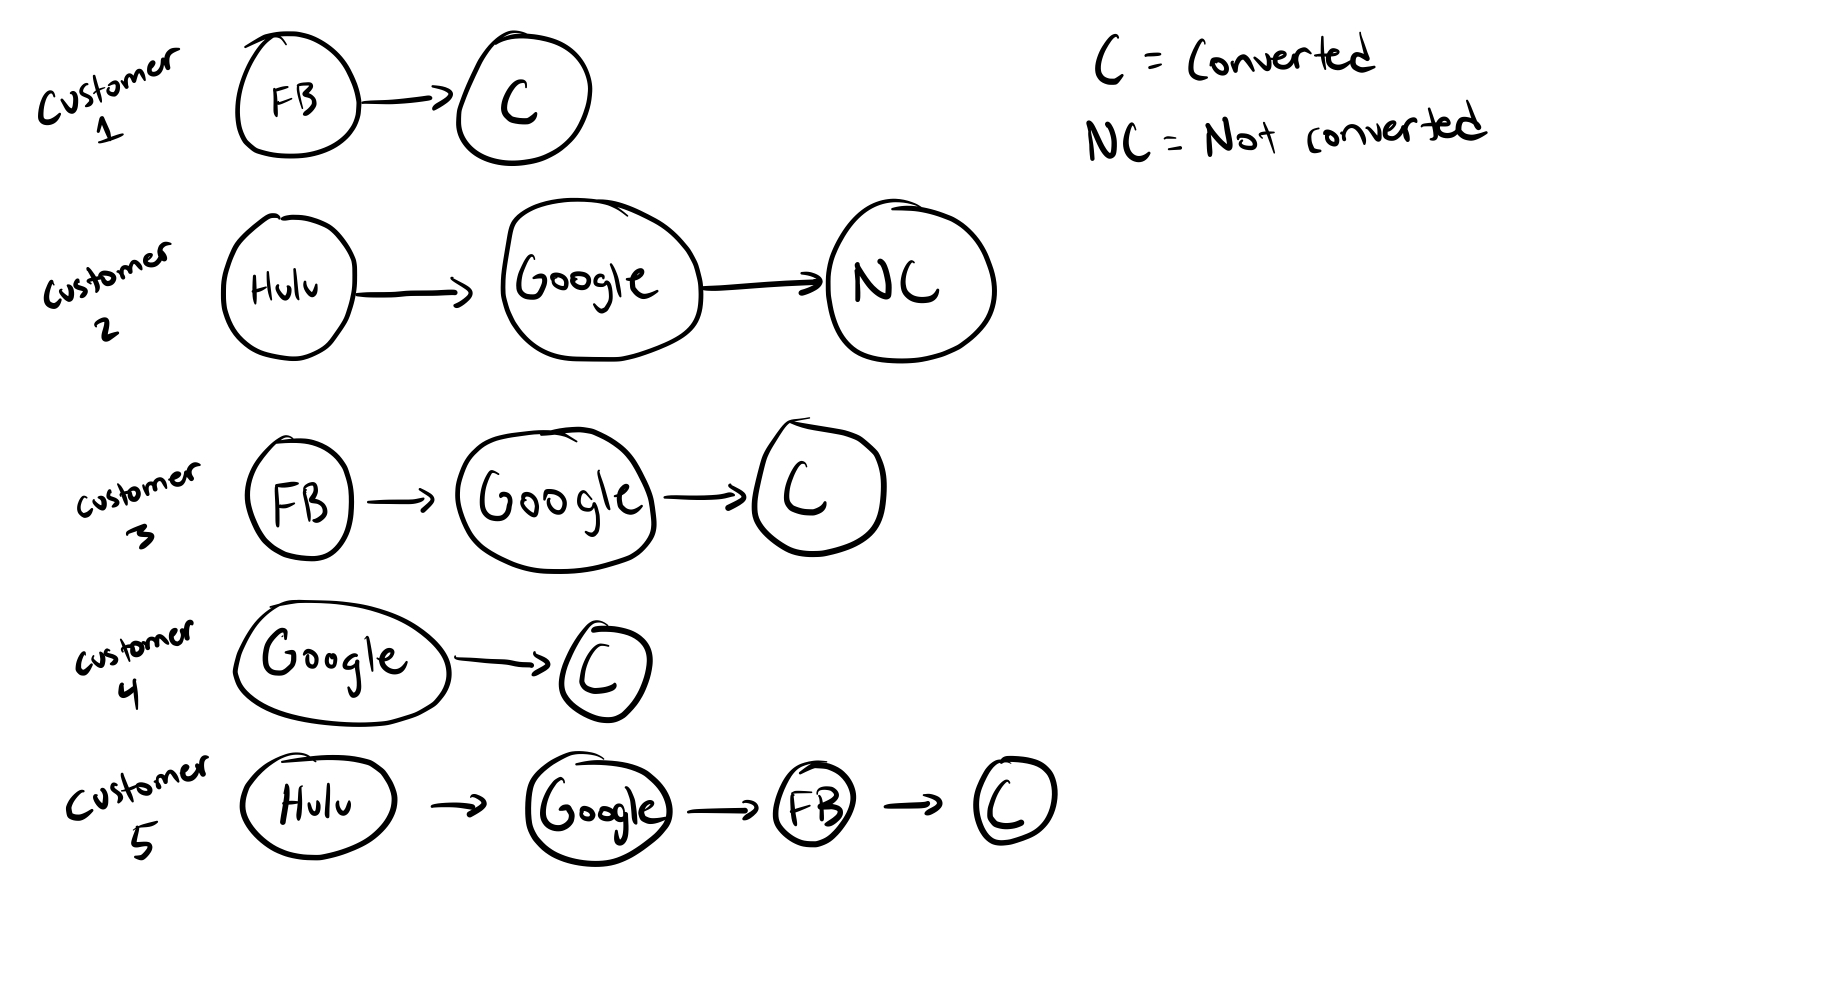
To calculate the probability of moving from any state to another state we look at all of the customer journey's and count the number of times a customer moved to each state. Here are five sample customer journeys.
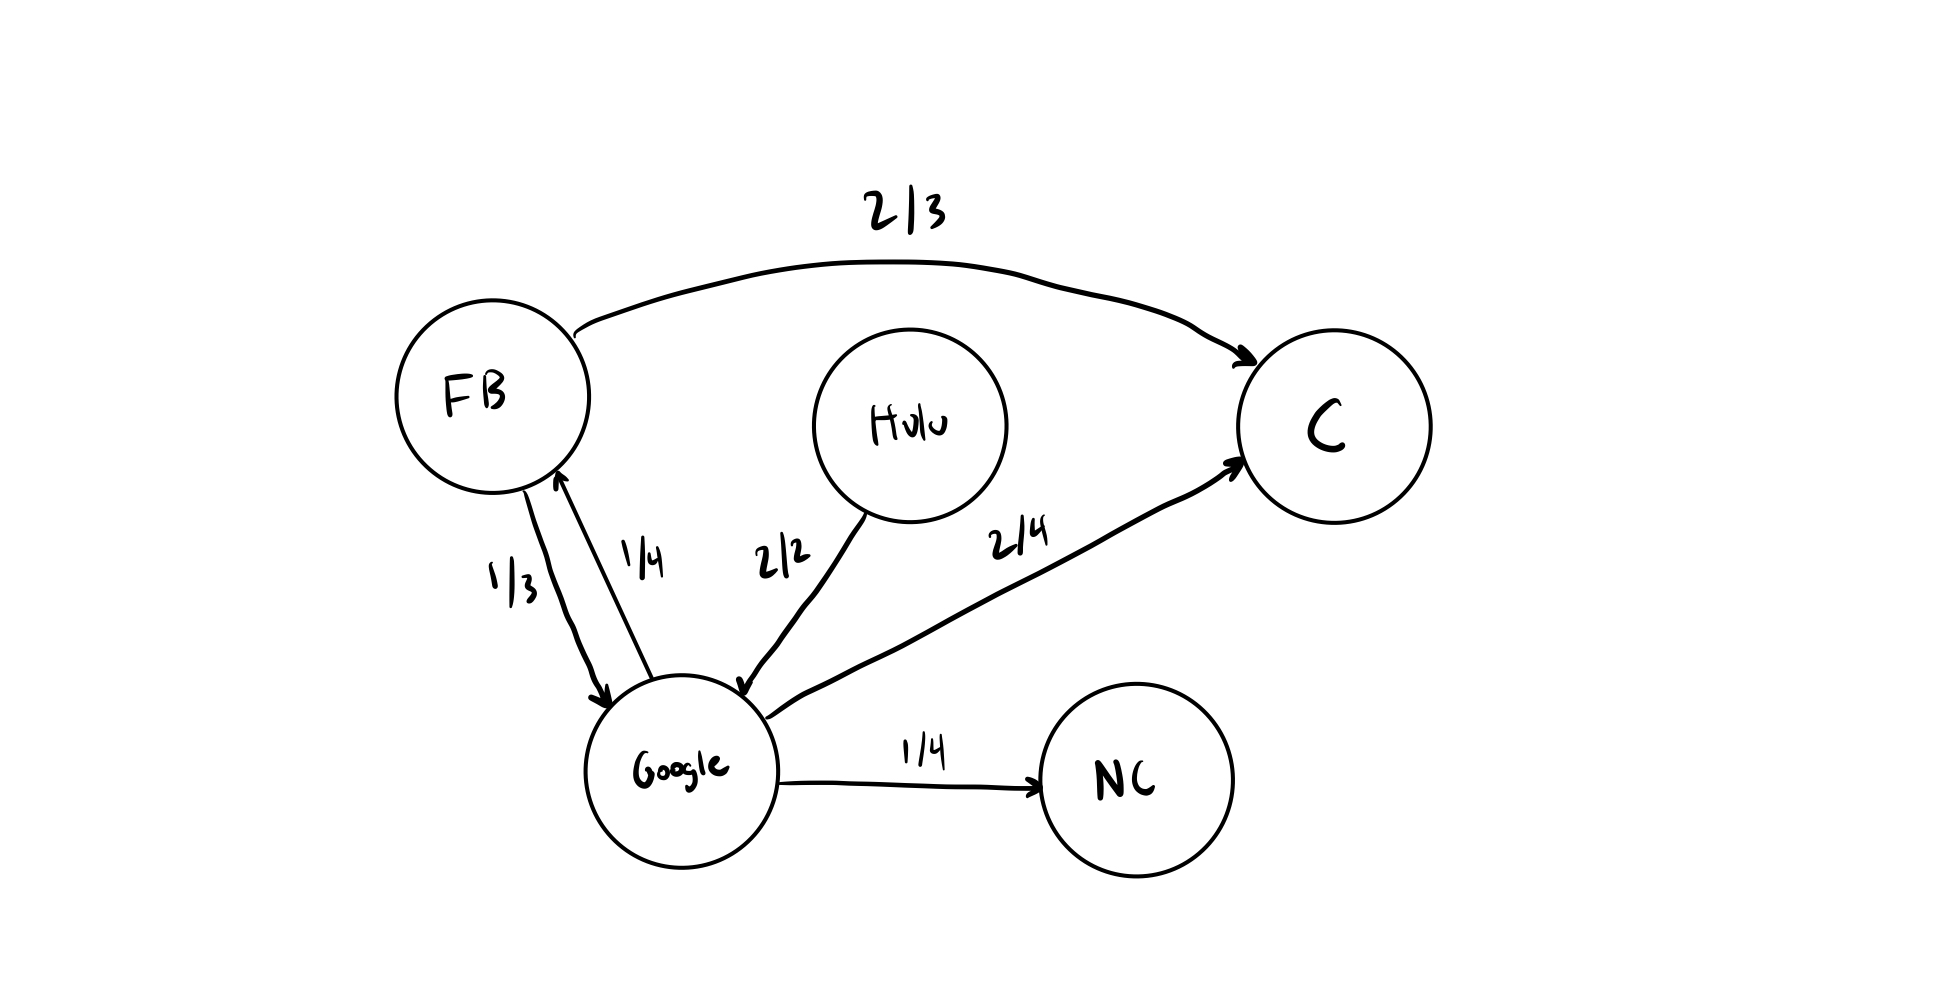
Now we can calculate our Markov Model. This diagram shows the probability from every state of going to any other state. If there is no direct line between any two states the probability of going from the current state to another state is 0.
From here we can use the Removal Effect to calculate the contribution or importance of any state. The below example shows calculating the Removal Effect for Facebook.
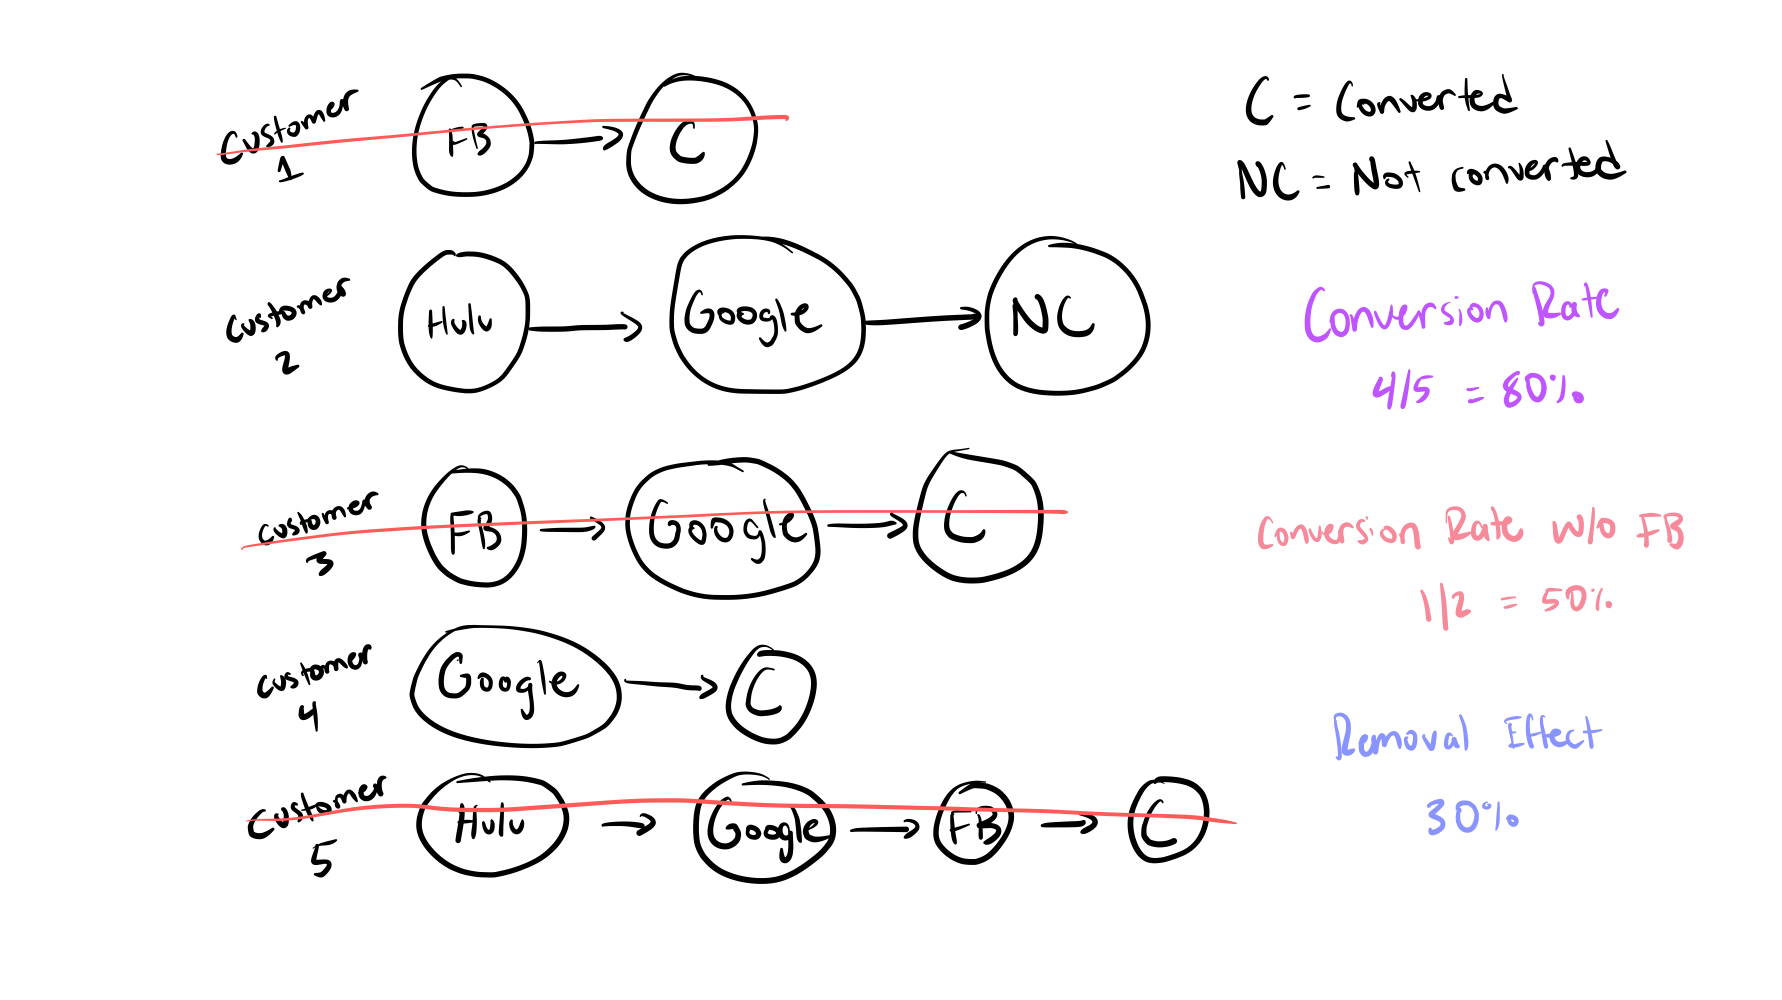
We can calculate the conversion rate by looking at the total number of customer journeys that end in a conversion. Next we remove all customer journeys that involve Facebook and recalculate the conversion rate. The difference between these two numbers is the Removal effect. If the number is negative the implication is that this channel makes users less likely to convert. For simplicity we will just 0 out any negatives and say this channel has 0 impact on conversion likelihood.
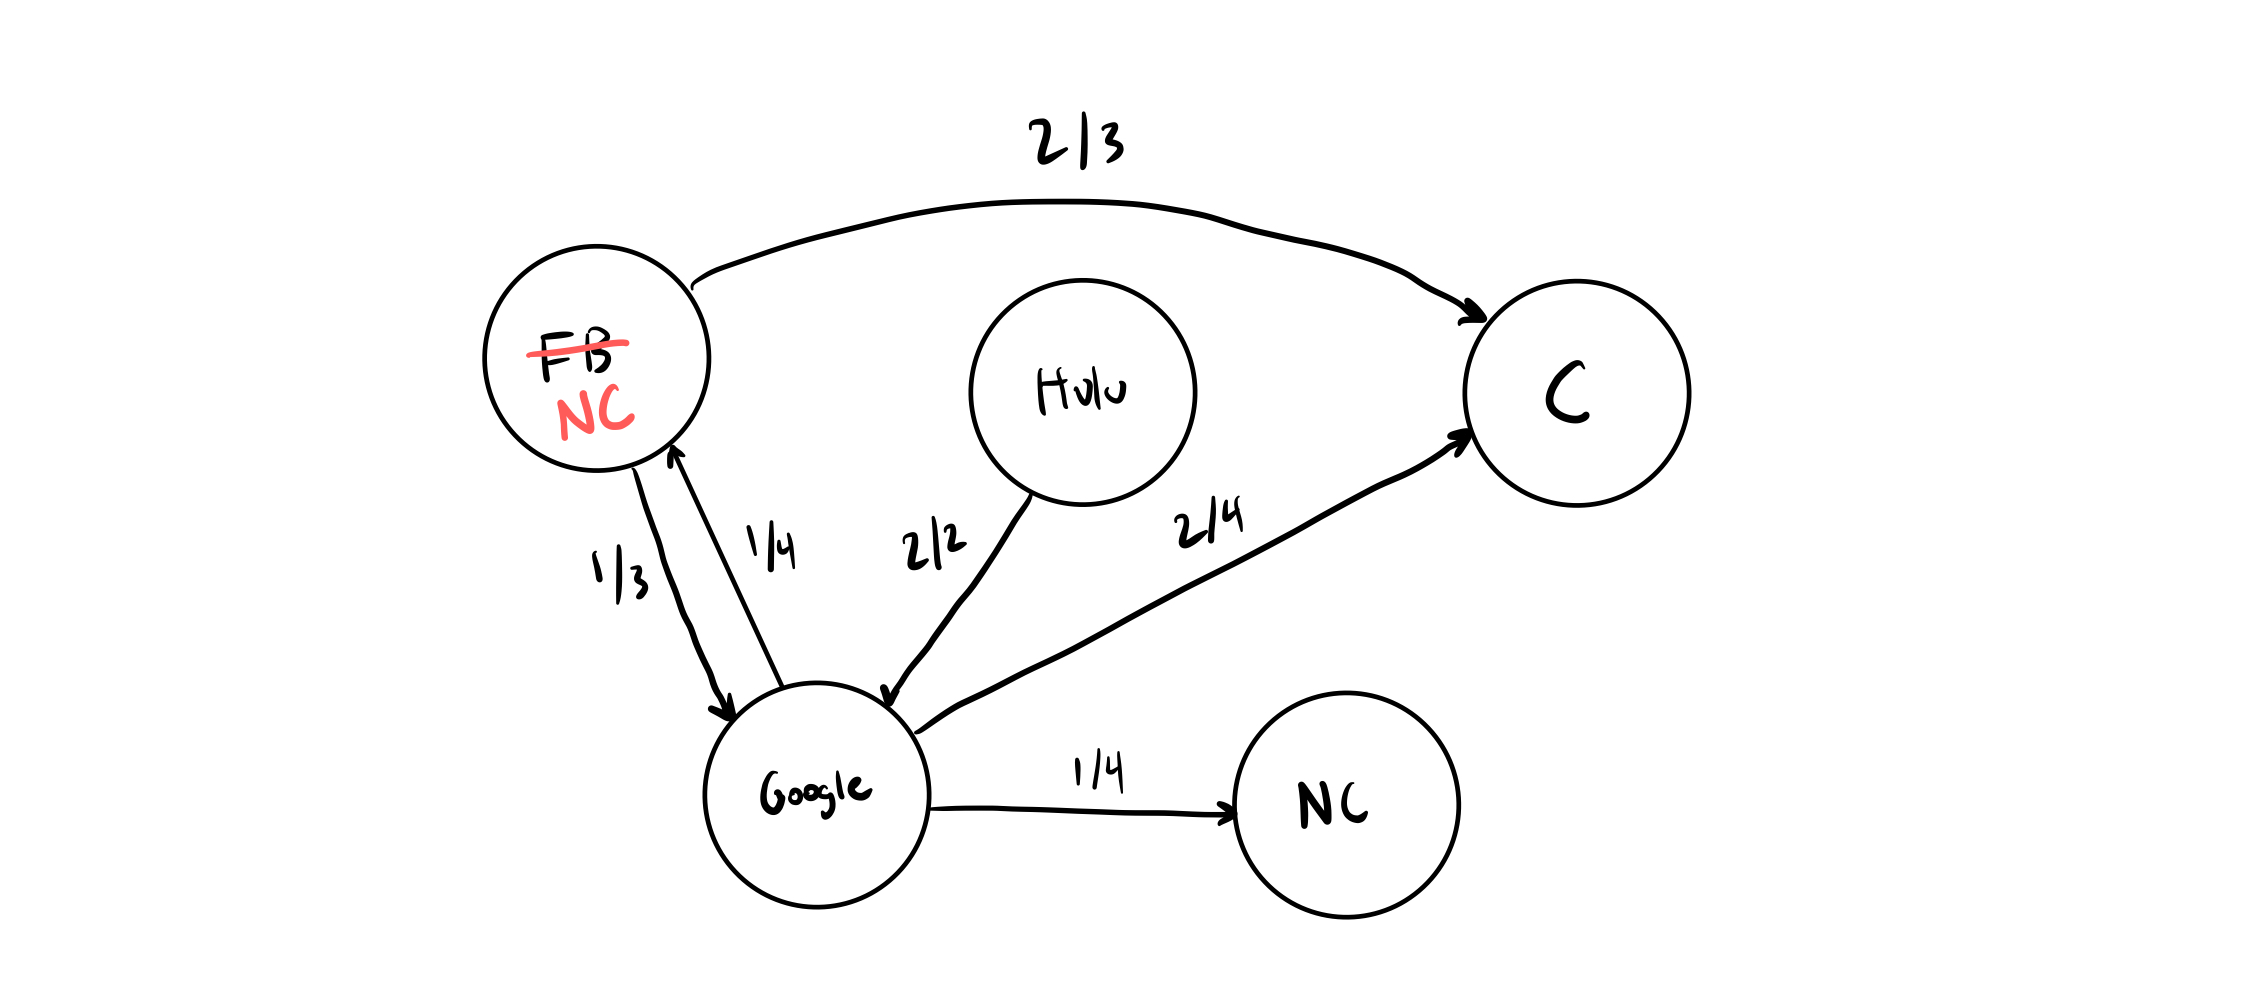
But what about the Markov model we drew above? For this example we can calculate the Removal Effect by going through every customer journey since there are only 5. In practice this could be millions with hundreds of touch points.
We use the Markov model as an aggregate model of the individual customer journeys and we can calculate the conversion rate by turning the target touch point to a Not Converted state. Therefore calculating all customer journeys that go through this touchpoint as Not Converted. From there we can calculate the Removal Effect.
After normalizing each Removal Effect value we are done. Now we have all of our values filled out. Note that in the Markov example due to the low number of touch points we ended up with 0s for Hulu and Google Search. This would probably be unliked in practice but just happened to be the case in this example.
Calculating ROAS based on MTA Attributed Revenue
Using the weights we discovered above we can calculate the Contribution value for each platform.
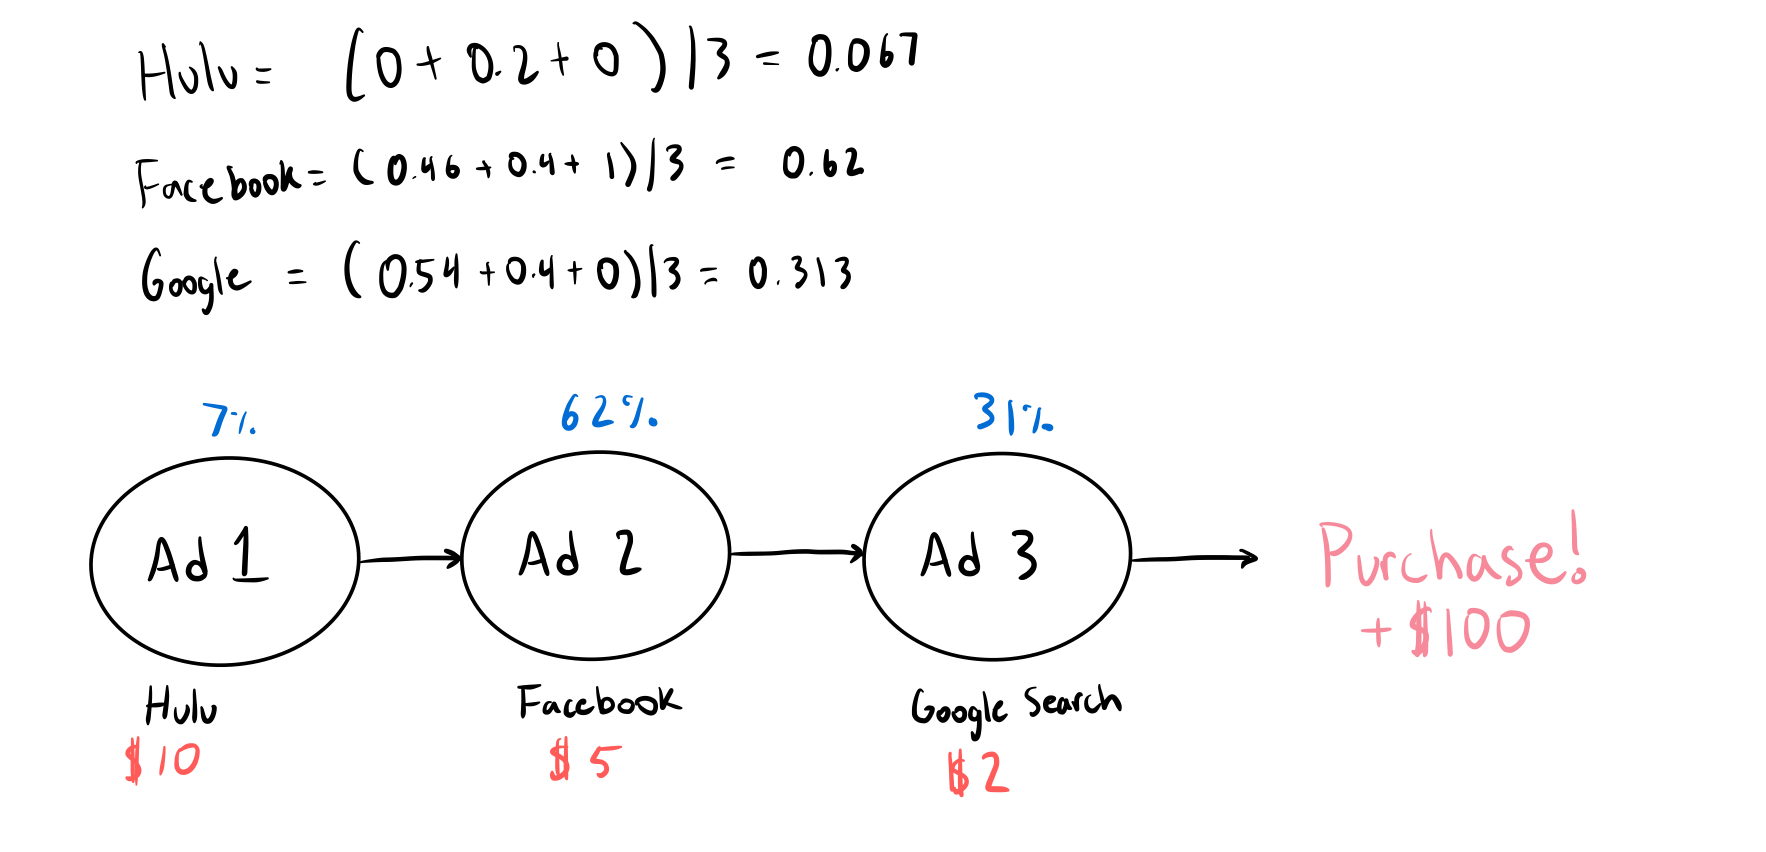
We use these values to determine how much revenue to attribute to each touchpoint in a customer journey and from there we can calculate an accurate ROAS.
In the end we have the final ROAS for each platform.
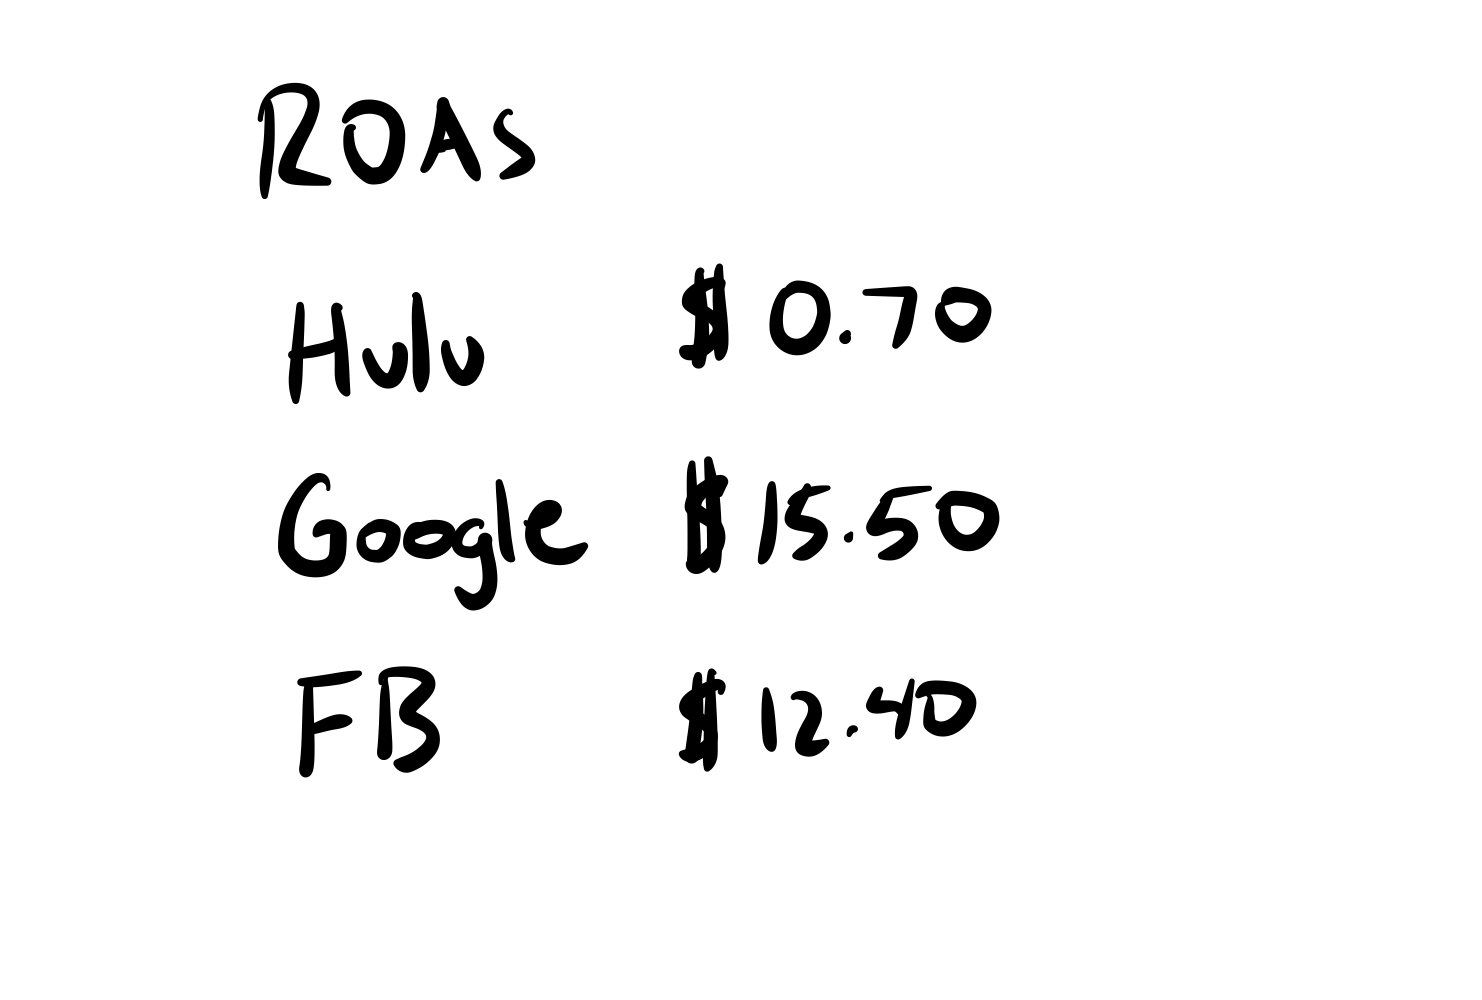
FB had a very high contribution compared to Google and Hulu but in the end it was also more expensive so Google beat out FB in terms of ROAS. We can see Hulu was greatly effected by the 7% contribution percentage and high $10 costs so it only drove 70 cent ROAS.
Using this data we would be able to make more accurate decisions around budget allocations for each platform. We could make changes in the platform hopefully increasing the contribution value and also make high level budgeting decisions around where to allocate our dollars.
Conclusion
So zooming back out. This model essentially determines the value of running on each platform. If the contribution score is low that will make ROAS look very bad compared to other platforms and this ultimately dictates investment in each platform.
The implications of the contribution function are vast. If we accidentally undervalue a platform we will spend less and lose money due to worse efficiency. AI systems allow you to scale massively so if you feed inaccurate ROAS info to another AI tool based on a fault MTA model you will be amplifying what every your problem is rapidly.
So we need to make sure our MTA model is great. How do we do this?
Feature Analysis
Each of the values we calculated is called a feature in AI. The goal is to find the most important features (the ones with the highest predictive value) and weight them accordingly. This can get complicated fast. There is a whole field of AI research dedicated to picking the right features. Generally the best way to think about it is you have an idea of something that might impact the outcome heavily and you convert it to a mathematical equation (aka model).
For example we theorized that the further from day of purchase the less important the touchpoint was. We could come up with a survey or study to validate this and once validated model it as a feature.
Testing an MTA Model
Ok now for the biggest question. How do we know if our MTA model works? The best way would be to split your audience and optimize campaigns based on the MTA model for one half and leave the other half as a control group. The problem here is its impossible to segment your audience across all marketing channels to get a clean A/B test.
Your next best bet is some variation of a Pre/Post test. How do sales look before and after turning it on? There are ways to make pre/post testing more reliable but its definitely not an ideal way of measuring especially for such an important system. So what do we do?
Invest heavily in confidence in the features you select. If they are reliable and good, theoretically the sum of them should also be reliable and good.
Implications
With all of the mathematical complexity that goes into these models it may seem they are far superior to simple attribution methods like Last Touch, Even or First Touch. But in practice without heavy testing these models may lend false confidence to a marketing team while actually leading them in the wrong direction.
Don't over rely on measurement in marketing. We should strive to measure. But as Jeff Bezos says.
"When the anecdotes and the data disagree, usually the anecdotes are right." -Jeff Bezos
There is an ever present tension in the marketing department around the last of measurement. Measurement tools exist to reduce uncertainty and do help to some degree. But if your intuition is screaming at you that an ad is horrible, despite the multimillion dollar AI model built by Math PhD's disagreeing. There is still a chance you are right.